Economic Update: Signs of Green Shoots
July 20, 2023
Recently equity markets have begun to rebound. We are of the opinion that chasing this rally is not prudent and investors should remain underweight in risk assets. Investors are being paid to wait in short-term fixed-income and money markets. The market environment is very tricky right now.
The full effects of monetary tightening (rate hikes, quantitative tightening and curtailed bank lending) will likely continue to slow down the economy. The economy could further weaken in the second half of 2023 as the probability of recession elevates. There are indications that policy tightening is working its way through the economy, with growth and inflation declining. Having raised policy rates for ten straight meetings since the spring of 2022, the Federal Reserve paused at its June meeting. However, they have signaled possibly two more rate hikes and will likely raise rates in July. The Fed remains hawkish.
We believe that keeping an eye on the long-term cycle is important. But what might cause us to become more optimistic about risk assets? We would need to see data that points to sustainable improvement in future economic growth. In this commentary, we highlight some of our tactical economic indicators (consumer confidence, leading economic indicators, economic surprise and improvement in cyclical sectors) that can point toward signs of clearer skies in the future. Rather than using a single indicator, we use a broad range in order to show a breadth of improvement. The weight of this data gives us more confidence that the upturn will “have legs.”
However, before going through those indicators, it is necessary to understand the catalyst that can set that future path in motion.
We believe the primary catalyst is falling core inflation. When core inflation starts moving downward toward the Fed’s target, the Fed could stop its rate hikes. The risk is that core inflation either flattens or rises, which can cause the Fed to remain hawkish.
While headline inflation has come down meaningfully due to falling energy and food prices, core inflation has been very stubborn, as seen in this graph from PGIM Fixed Income.
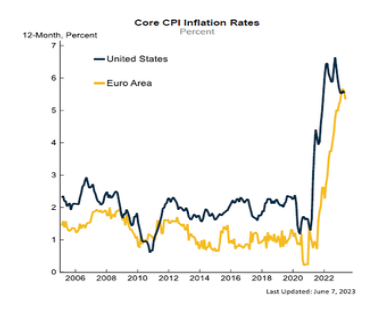
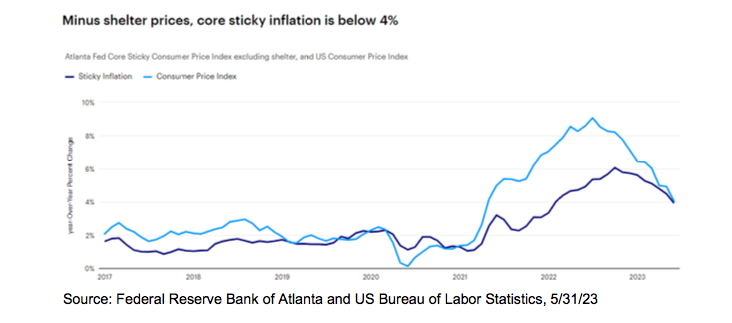
While core remains significantly higher than the Fed’s target, there are signs that core inflation could start to fall. Core sticky inflation (minus rents) is below 4% over the past year, per the Atlanta Fed. Falling rents will be key in pushing down core inflation. Fast-moving indicators are showing that rental inflation should ease.
After determining a primary catalyst, we now switch to economic indicators which could point toward “green shoots,” germinating possibly next year. The primary economic tactical indicators include Consumer Confidence, Leading Index of Economic Indicators, Economic Surprise and Cyclical Sectors Demand.
Consumer Confidence
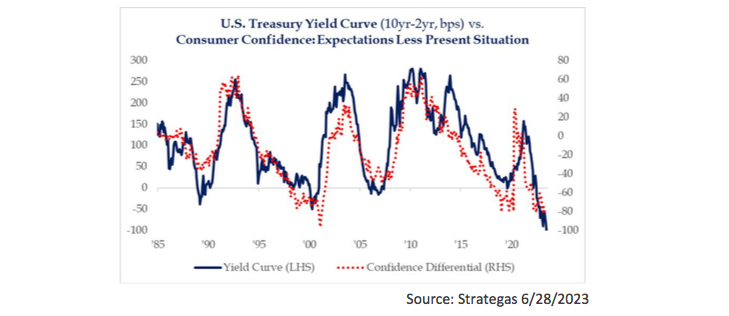
Consumption is responsible for nearly 70% of the US economy. As a result, confidence is key. Particularly, when expectations of the future are dim, households are likely to cut back on spending, thereby triggering a recession. When the gap between the future and the present is negative, it often precedes a recession (1990, 2000, 2008). The gap is strongly negative now and at levels consistent with recession. When the consumers start feeling more confident about the future, the skies should begin to clear.
Leading Index of Economic Indicators (LEI)
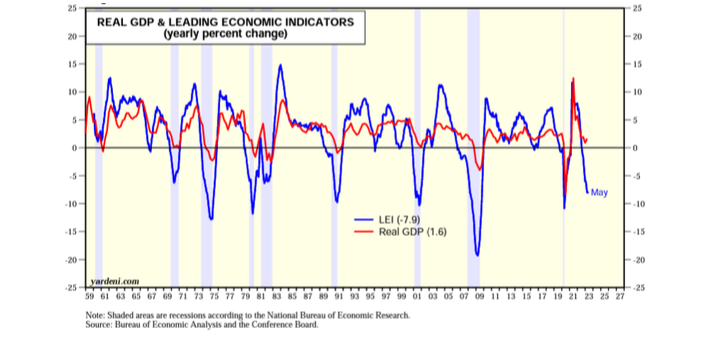
LEI points to significant turning points in the business cycle and where the economy is heading in the near term. It is a compilation of economic activity and financial markets that point toward future economic activity. Particularly of interest to us are components such as new orders, average working hours and building permits. The Conference Board’s Index of Leading Indicators declined in May for the fourteenth straight month and at levels that have historically pointed to recession (shaded in grey below). When the LEI turns upward, particularly with improvements in new orders and building permits, the economy could start to pick up momentum. That indicator has not yet turned positive.
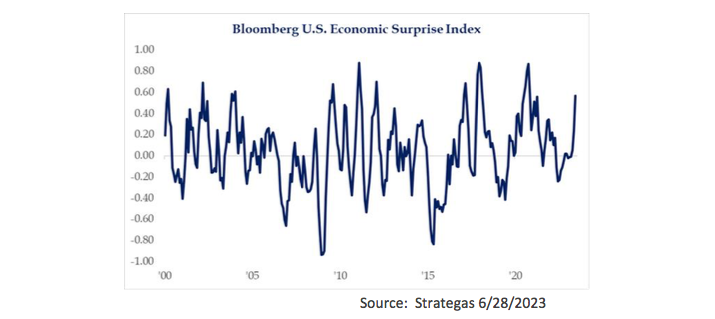
Economic Surprise Index
The Economic Surprise Index shows how actual economic data results have compared to the forecasted data. Markets tend to look forward and, as a result, use forecasted data. When actual data comes in better or worse than expected, it affects asset classes. Recently, economic data has come in better than expected, which could have underpinned the recent equity rally.
Cyclical Drivers
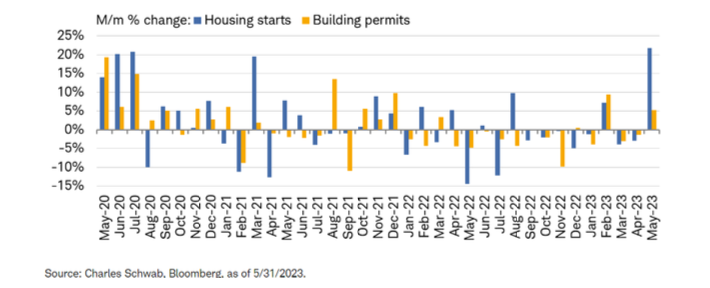
Housing, capital expenditures, autos and inventories are sectors that drive economic activity. The first three are levered and have strong multiplier effects and analyzing those sectors are key in understanding the business cycle. Credit conditions and pent-up demand are therefore essential in understanding the strength behind these drivers. Housing is the strongest of these drivers given its enormous size. Housing activity was weak due to higher mortgage rates. However, the most recent data on US housing starts surged 21.7% on a month-over-month in May, the largest monthly increase since October 2016 and the seventh increase of 20% or more dating back to 1989. New home purchases also jumped 12.2%, the fastest annual rate in over a year. Another important leading indicator, building permits, rose in May, pointing toward future construction.
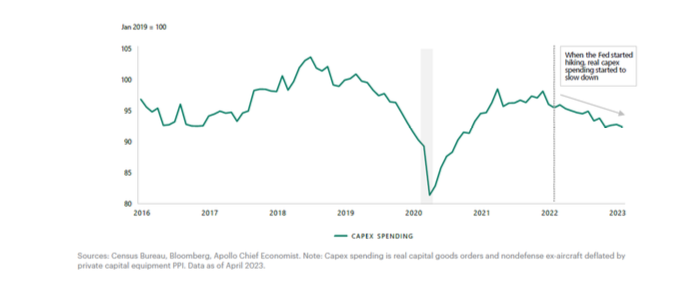
Capital Expenditure (CapEx) is another strong cyclical driver. Aggregated regional Fed surveys for June showed that the CapEx plans index jumped 8.3 pts to 13.5, its highest reading this year. CapeEx has increased for the first time in over a year. Companies increase capital expenditures when they see demand increasing ahead.
Looking forward, two other cyclical areas, including autos that have strong pent-up demand and inventories that need to be restocked, should also help ignite a new economic cycle.
The economy is likely to slow in the near term due to monetary policy and lending tightening. Currently, the market environment is tricky because the economic data is mixed. Two of our indicators, the Economic Surprise Index and Cyclical Drivers, have very recently started to improve. However, the other two indicators, Consumer Confidence and LEI, are still negative. When all four tactical economic indicators turn positive, it will be time to be more optimistic about risk assets. We will continue to keep a close eye on them.
DISCLAIMER
This document contains our current opinions and commentary that are subject to change without notice. Our commentary is distributed for informational and educational purposes only and is not investment advice and does not consider the specific investment objective, financial situation, or particular needs of any recipient.
Opinions and estimates offered constitute our judgment and are subject to change without notice, as are statements of financial market trends, which are based on current market conditions. Certain hypothetical market situations herein are based on historical data.
Certain statements contained herein may constitute “forward-looking statements.” Due to various risks and uncertainties, actual events or results or the actual performance may differ materially from those reflected or contemplated in such forward-looking statements. All investment involves the risk of loss.
Information contained herein has been obtained from sources we believe to be reliable, but we do not guarantee its completeness or accuracy. The information contained herein does not constitute legal or tax advice to any person. Please consult with your tax advisor regarding any taxation implications of the information presented in this presentation.

