Debt Ceiling Update
May 3, 2023
The U.S. is fast approaching the “X” date when the Treasury runs out of funds to meet debt obligations. The following are the key dates:

This past Wednesday, the House of Representatives passed a proposal to increase the debt ceiling. Although the bill as presented is unlikely to be agreed upon by both the Senate and White House, it nevertheless decreases the probability of default at the “X” date. It is a positive first step toward getting the debt ceiling raised on time. The reason is that it shows a willingness to meet the country’s obligations. The debate is now about how to raise the ceiling, not whether to raise the debt ceiling. That is a very important distinction. The negotiating process kicks off the difficult part, in our opinion, but at least it has begun. Finding a workable agreement by the “X” date will not be easy, and we expect short-term volatility in asset markets.
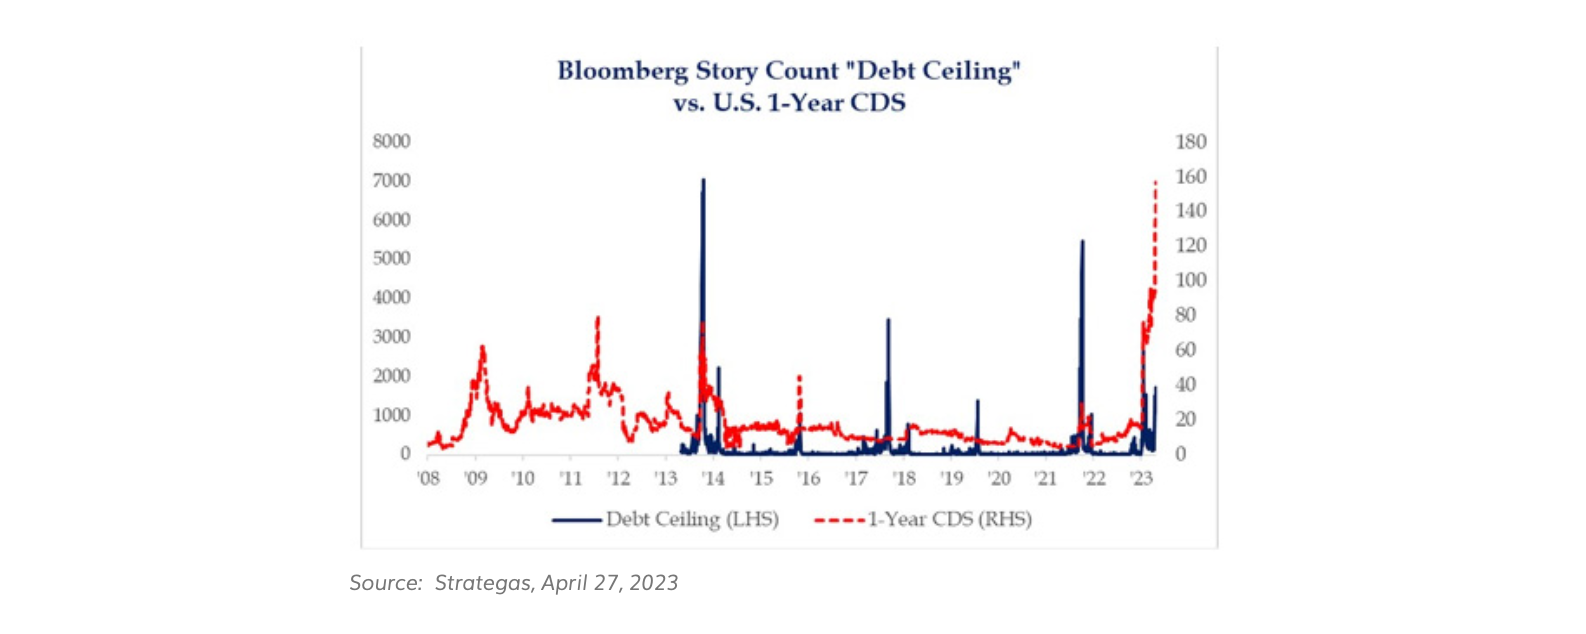
The market has become more nervous about a potential default. It can be seen by the recent spike in credit default spreads for U.S. Treasuries:
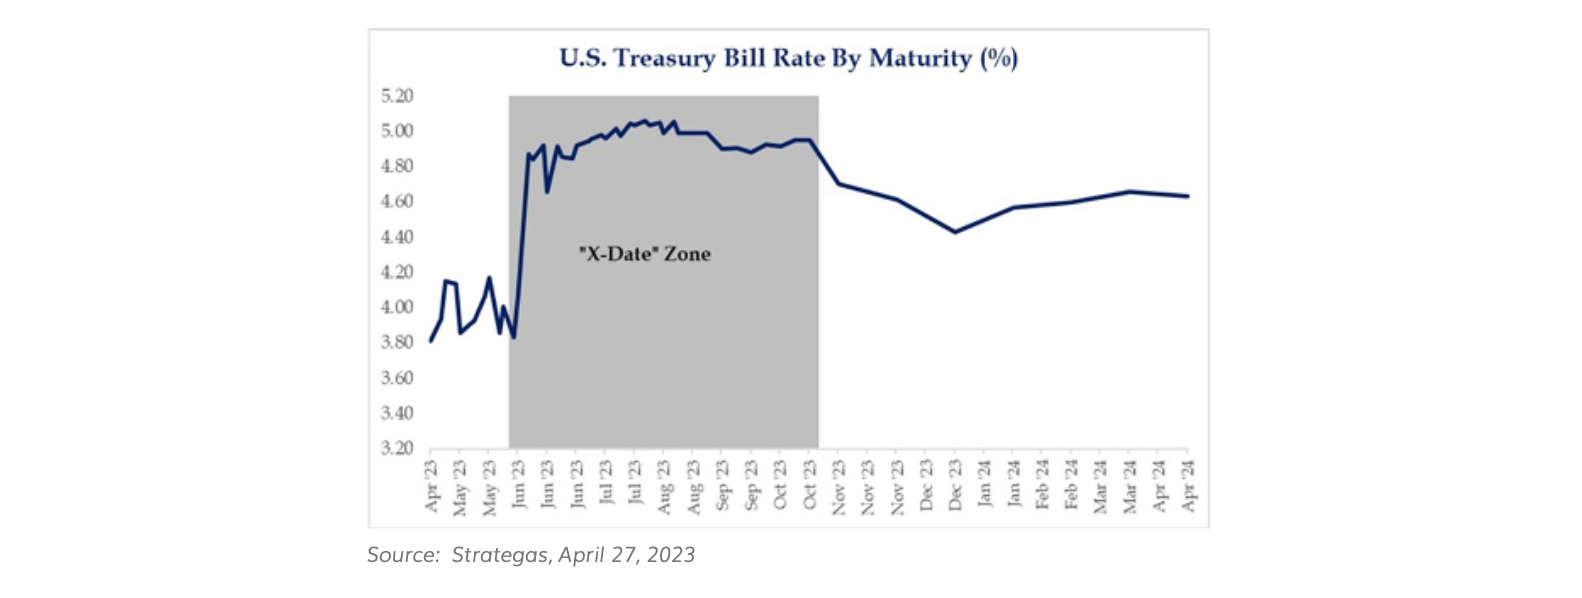
This has led to higher yields for short-term, three-month Treasury bills, which are now yielding 5.17% – a post-2007 high. The following graph of T-bill maturities shows the impact across the T-bill curve.
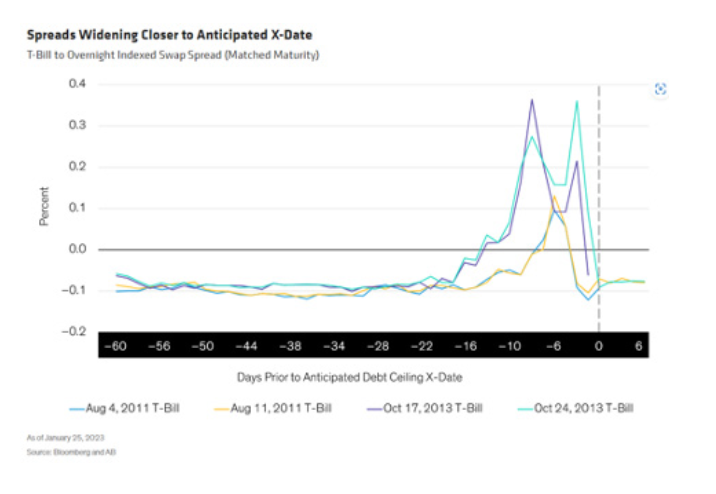
As a result of the higher yields and the willingness to negotiate, which lowers the probability of default, T-Bills now look attractive. The probability of an actual default appears to be very low in our estimation.
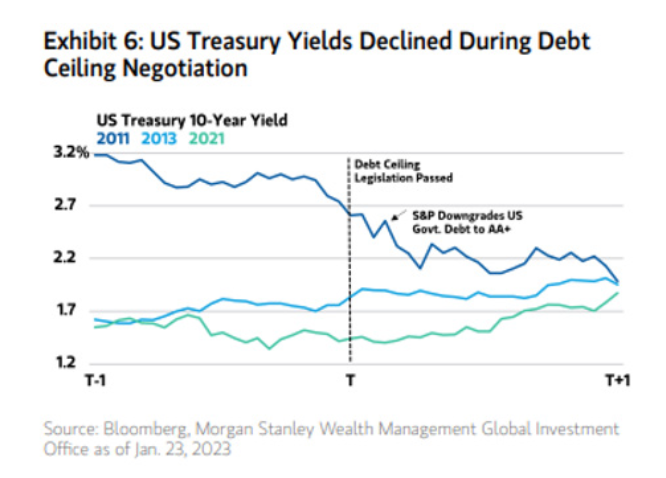
However, if a default occurs, ironically, longer-dated Treasury bonds might go up in value. The flight to quality could actually drive down yields, as investors seek safety and other asset classes feel a much stronger effect.
We have looked at how various asset classes performed during previous debt ceiling standoffs, particularly in 2011 and 2013.
1. Short-Term Treasury Bills
In 2011 and 2013, yields quickly spiked as the “X” date approached. Recently T-bill yields have risen, reflecting fears over the current deadline. As a result, the short end now offers a yield premium.
2. Ten-Year Treasury Bonds
Ironically, the value of bonds rose as yields fell in 2011. Despite the downgrade by S&P, treasury bonds still rallied. It should be noted that, at the time the Euro area was facing a sovereign debt crisis involving Greece, U.S. bonds could have acted as a flight-to-quality despite the debt ceiling issues. In contrast, during the 2013 negotiation, yields did increase.
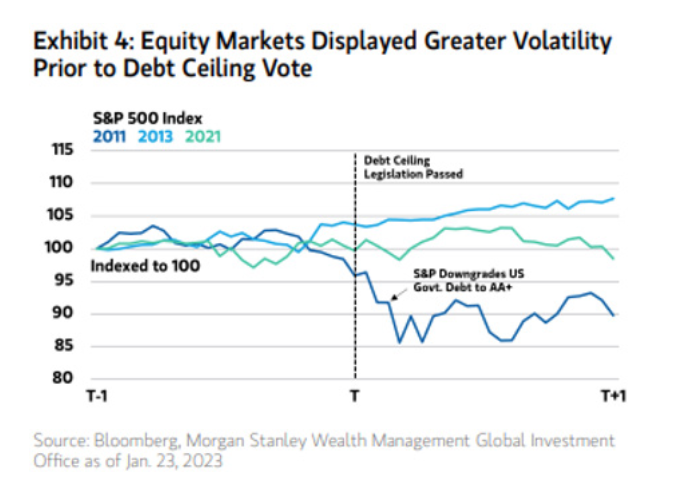
 3. S&P 500
In 2011, the stock market was very volatile and declined significantly. The downgrade of the U.S. credit rating by S&P further worsened sentiment. The market continued to stay volatile. However, in 2013, the equity market was far less volatile, and for the most part, shrugged off the political events.
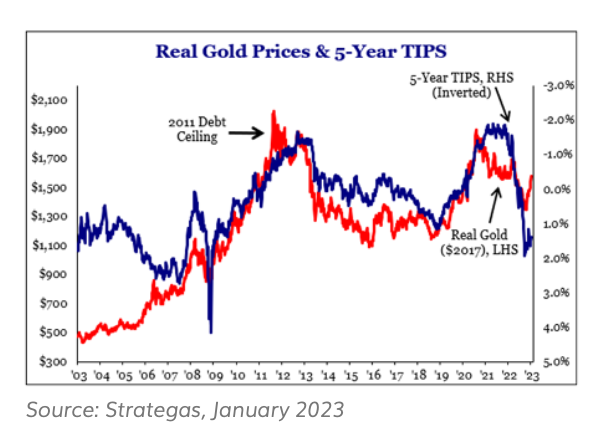
 4. Gold
Gold rose strongly in 2011 and reached a multi-decade high. However, it started to fall in 2012 and was likely driven by lower interest rates. It largely shrugged off the 2013 incident.
Source: Strategas, January 2023
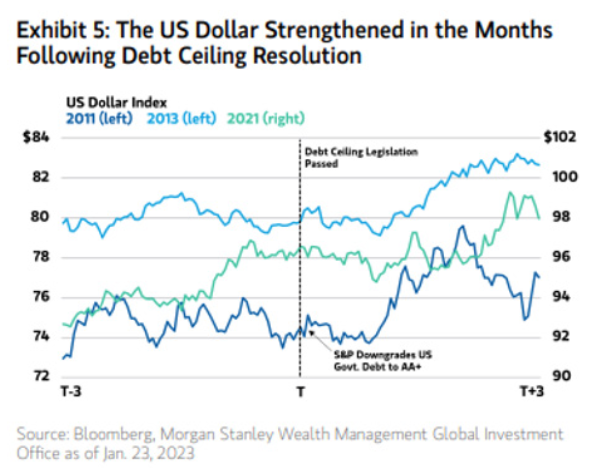
 5. S. Dollar
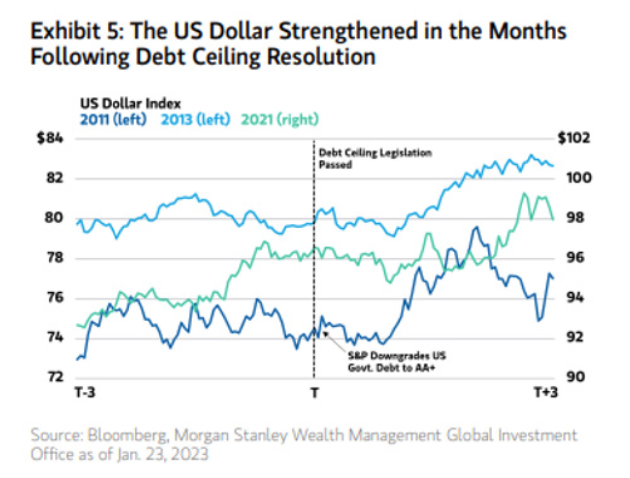
In 2011 and 2013, the U.S. dollar was volatile before an agreement was reached. After the agreement, it rallied strongly.
In summary, even if the brinkmanship is pushed all the way to the edge, we expect a deal will be reached before default. However, markets are likely to become more volatile, as we move toward the “X” date. We will continue to monitor political developments. Please consult with your advisor if you are concerned about the potentially excessive volatility and want to understand how your portfolio is positioned against that volatility.
Click here to download the PDF.
DISCLAIMER
This document contains our current opinions and commentary that are subject to change without notice. Our commentary is distributed for informational and educational purposes only and is not investment advice and does not consider the specific investment objective, financial situation, or particular needs of any recipient.
Opinions and estimates offered constitute our judgment and are subject to change without notice, as are statements of financial market trends, which are based on current market conditions. Certain hypothetical market situations herein are based on historical data.
Certain statements contained herein may constitute “forward-looking statements.” Due to various risks and uncertainties, actual events or results or the actual performance may differ materially from those reflected or contemplated in such forward-looking statements. All investment involves the risk of loss.
Information contained herein has been obtained from sources we believe to be reliable, but we do not guarantee its completeness or accuracy. The information contained herein does not constitute legal or tax advice to any person. Please consult with your tax advisor regarding any taxation implications of the information presented in this presentation.

