Equity — Strategy Framework
December 14, 2023
Overview
Stocks have been very volatile. In the third quarter, there was a correction where the S&P 500 dropped more than -10% to then bounce back by 10% in November. This leads us to an important question: Are we at the beginning of the cycle’s end, or are we starting a new market cycle?
In order to get a better sense of what is driving the market, we need to put together the pieces of the puzzle using an equity strategy framework. It helps us structure the massive amount of data that impacts equities.
Many of the indicators in our framework are currently flashing yellow, which is better than the broad number of red lights we saw six months ago. The weight of data points to a neutral allocation to equity. We believe it is premature to chase the rally and recommend clients stay well diversified and utilize the strength of core bonds to ride out the volatility.
Equity Market Framework
Our equity market framework consists of fundamentals, valuation, sentiment and liquidity—the four legs of strategy. This approach allows us to take a holistic view of the equity market drivers. In this paper, we will populate the framework with a few data sets to illustrate how strategy is formulated.
1. Fundamentals
Earnings are the most important of the fundamental indicators. The reason is that stocks track earnings growth:
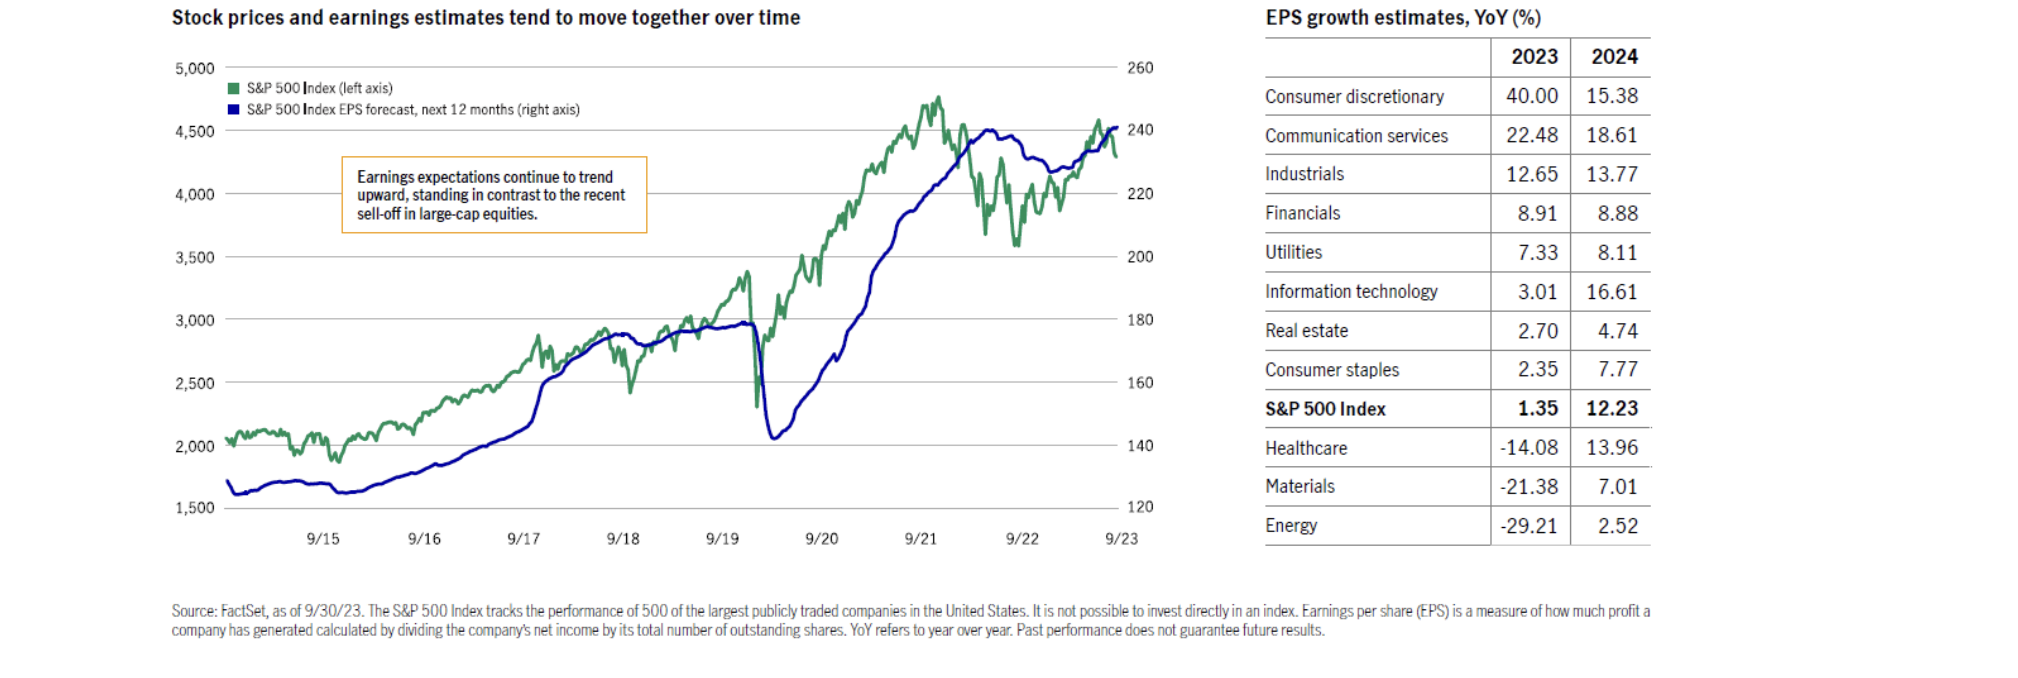
It is important to note that earnings growth has been nearly flat for the past two years, and so has the S&P 500. Third quarter earnings surprised on the upside. It was expected to be negative but instead turned positive for the first time in over a year. This is important because it could possibly signal the start of a new market cycle. However, we think the positive earnings growth was due to the abnormally large economic growth spurt in the third quarter. Nominal GDP growth (i.e., real growth plus inflation) came in at 9% (annualized), and it is nominal GDP that drives revenue and profits. The market now expects that next year will have strong earnings growth of approximately 12%. The major question is: How likely will earnings actually meet the lofty expectations embedded in equity market valuation?
Earnings growth is impacted by the economy. A growing economy will support revenue growth and profits (and vice versa). The expectation is that the economy will slow significantly next year, with estimates of 2024 real economic growth ranging from 0.5% to 1.5%. The Atlanta Fed GDP model now has fourth-quarter real growth at 2.0%. Inflation is expected to fall into the 2.5% to 3.5% range. As a result, it is difficult to see how 2024 nominal earnings expectations will be met.
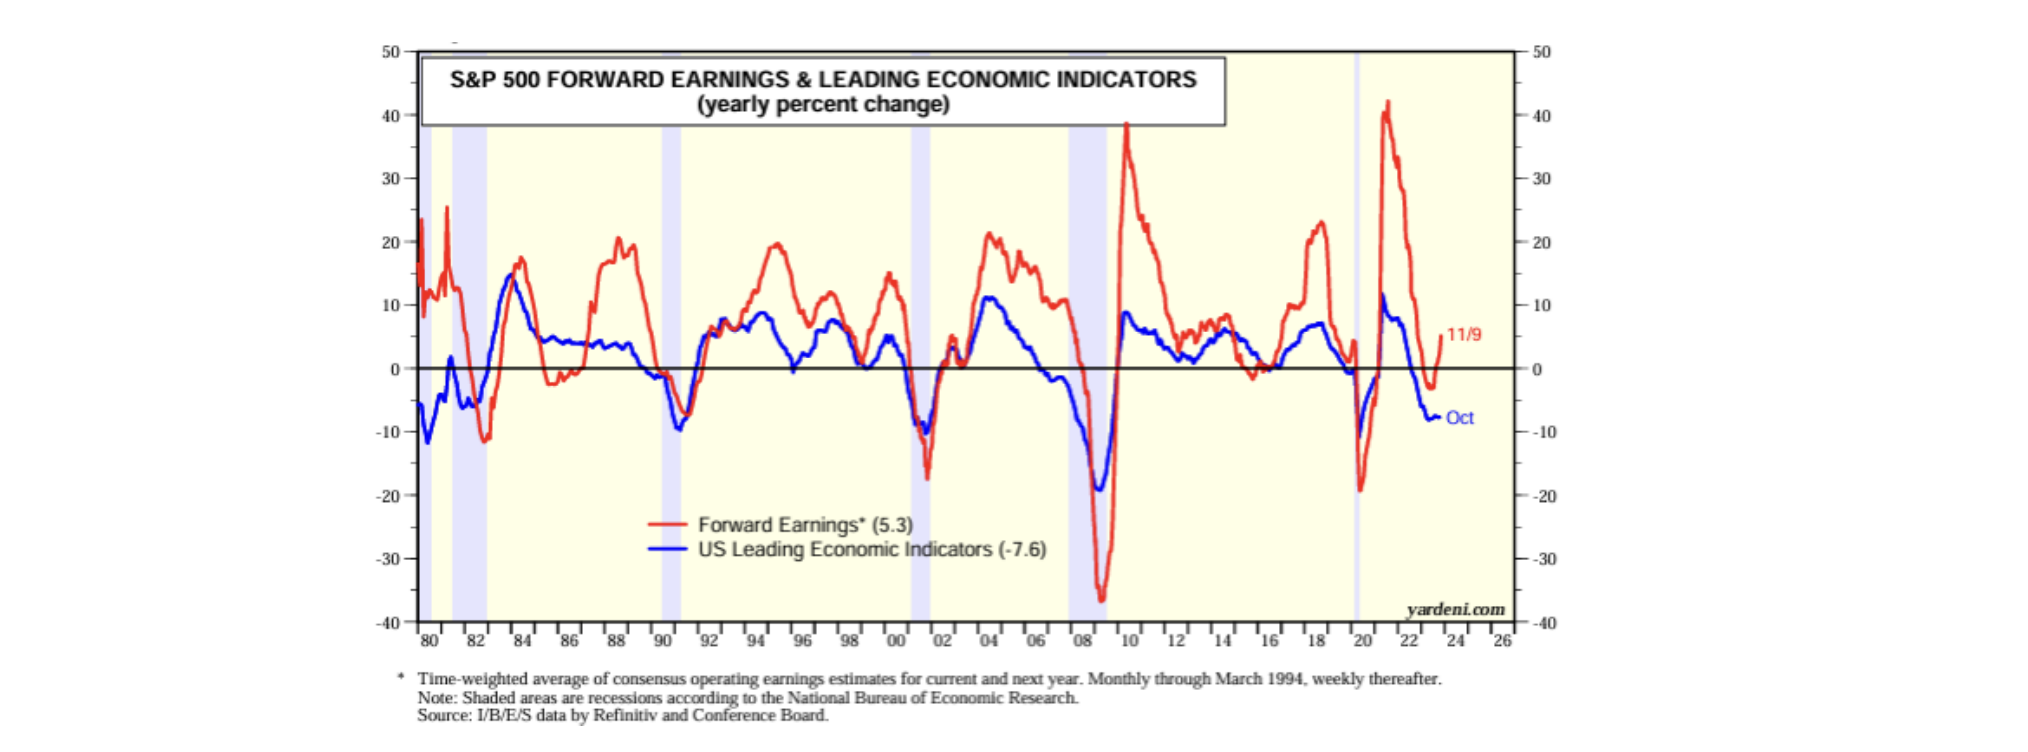
We use a broad range of data, including the leading index of economic indicators, yield curve shape, purchasing manager indices, lending officer surveys, Citi Surprise Index and coincident index, to assess the economic outlook. One of those key metrics, the leading index of economic indicators (LEI), is at levels that were recessionary in the past. Note how profits track the LEI:
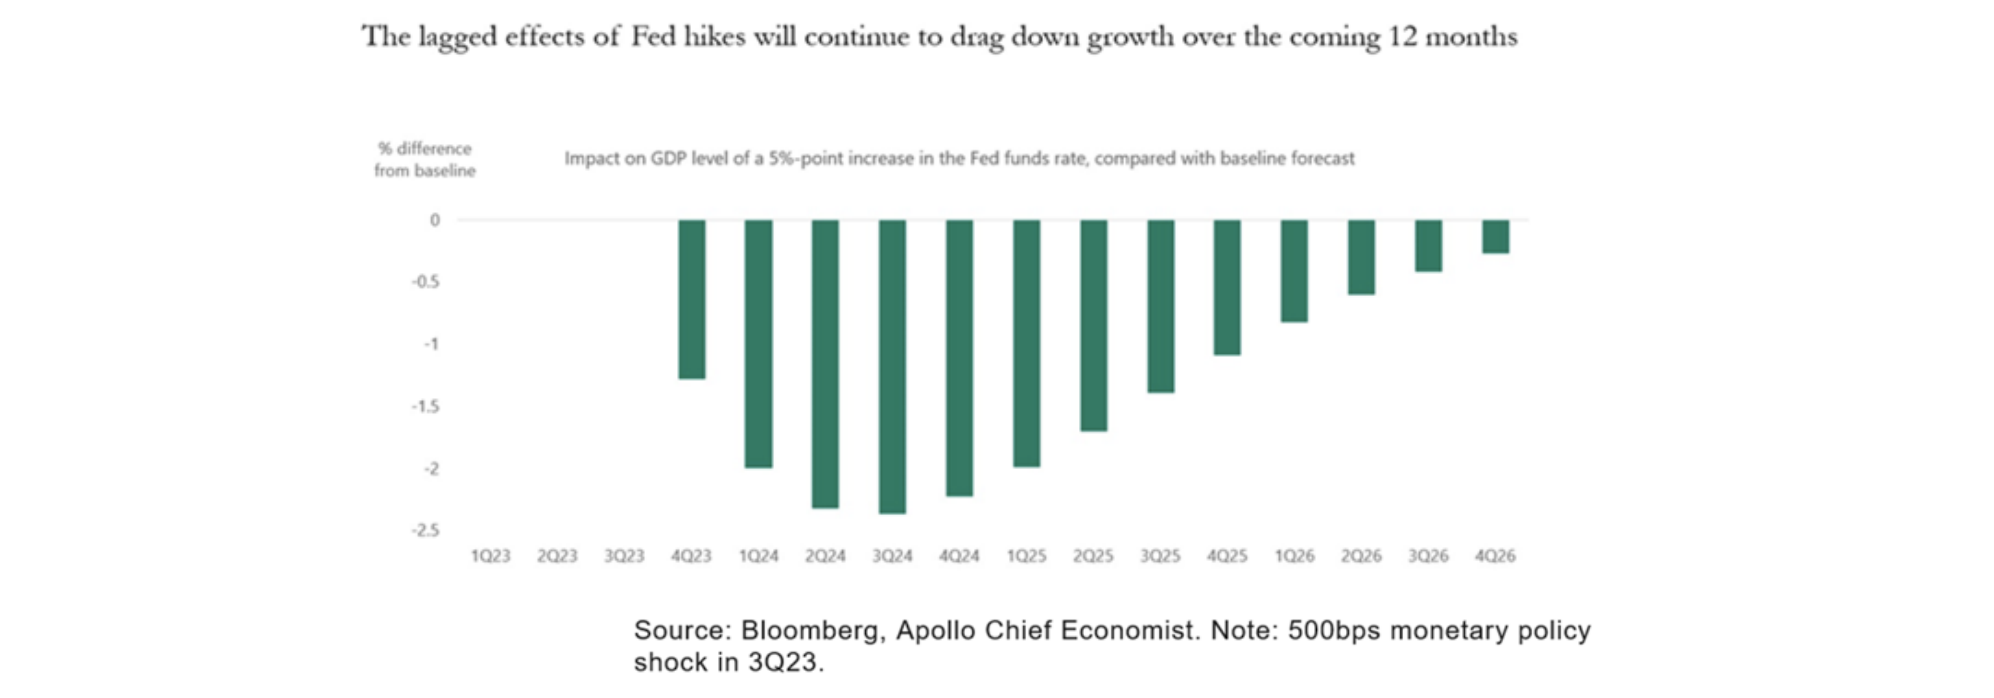
The market expects a soft landing to occur. Over the first half of next year, the lagged impacts of policy tightening are likely to be felt more strongly:
The key to assessing whether the economy will go through a hard or soft landing is to analyze the cyclical sectors that power the economic cycle. There are three main “cylinders” that drive the economy:
- Housing: This is the strongest of the growth cylinders, is very rate sensitive and has been severely impacted by higher mortgage rates. Home sales have fallen significantly since the Fed started hiking rates. However, in the third quarter, housing contributed positively to the economy for the first time in nearly two years. Moreover, October housing starts and building permits grew.
- Capex: Rising rates have caused the corporate sector to delay investment. But October core durables improved to flat from negative.
- Autos: Short-term numbers have been messy due to the auto strikes, but there is very large pent-up demand from Covid.
Recently, we are seeing those cylinders of economic growth starting to flicker on. The cylinders will likely take stronger hold later next year after the lagged effects of monetary policy start to wane. These cyclical sectors drive economic growth, impacting employment, income, inflation and Fed policy. As a result, either a shallow recession or soft landing is more likely than a severe hard landing. Overall, fundamentals are currently neutral, in our opinion.
However, in either outcome, we think the market has gotten ahead of itself and question how the stock market will generate a 12% earnings growth when both the economy and inflation are slowing significantly. This gap should cause equity markets to be volatile.
2. Valuation
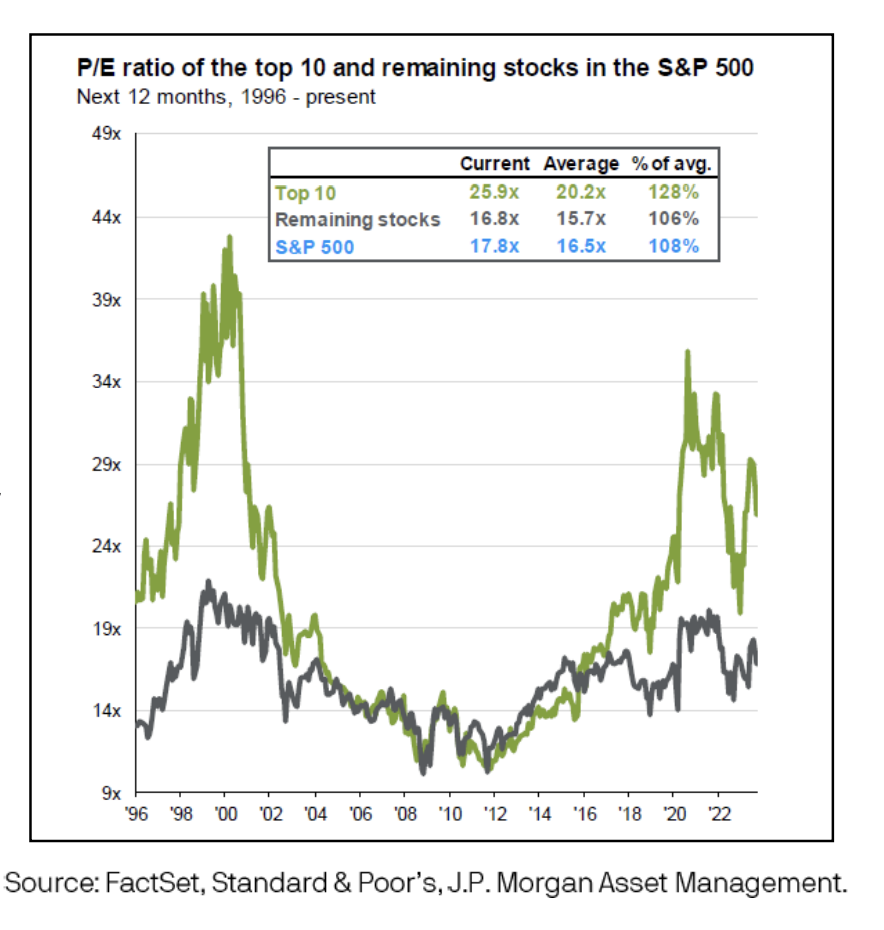 The second leg of our framework is valuation. Starting valuation has a significant impact on long-term returns.
A broad range of valuation metrics, such as price-to-earnings (P/E) and equity risk premium (ERP) show that the S&P 500 is expensive.
However, the overall market multiple is distorted by the “Magnificent 7” (tech companies). The other 493 are more reasonably valued. But they are not cheap. Historically, new market cycles involve cheap valuation and a leadership change. So far, tech stocks continue to lead.
As a result, our overall assessment of valuation is neutral.
3. Sentiment
We look at consumer sentiment because not only does consumption drive nearly two-thirds of the US economy, but consumers are also investors. As a result, markets tend to be emotional in the short term. It may seem counterintuitive, but high confidence tends to lead to lower returns and vice versa. That is because emotions tend to cause markets to overshoot in both directions. Recent sentiment bottomed in June and has been recovering. It has room to move back to its historical average, which should be positive for the market, as seen in the following chart:
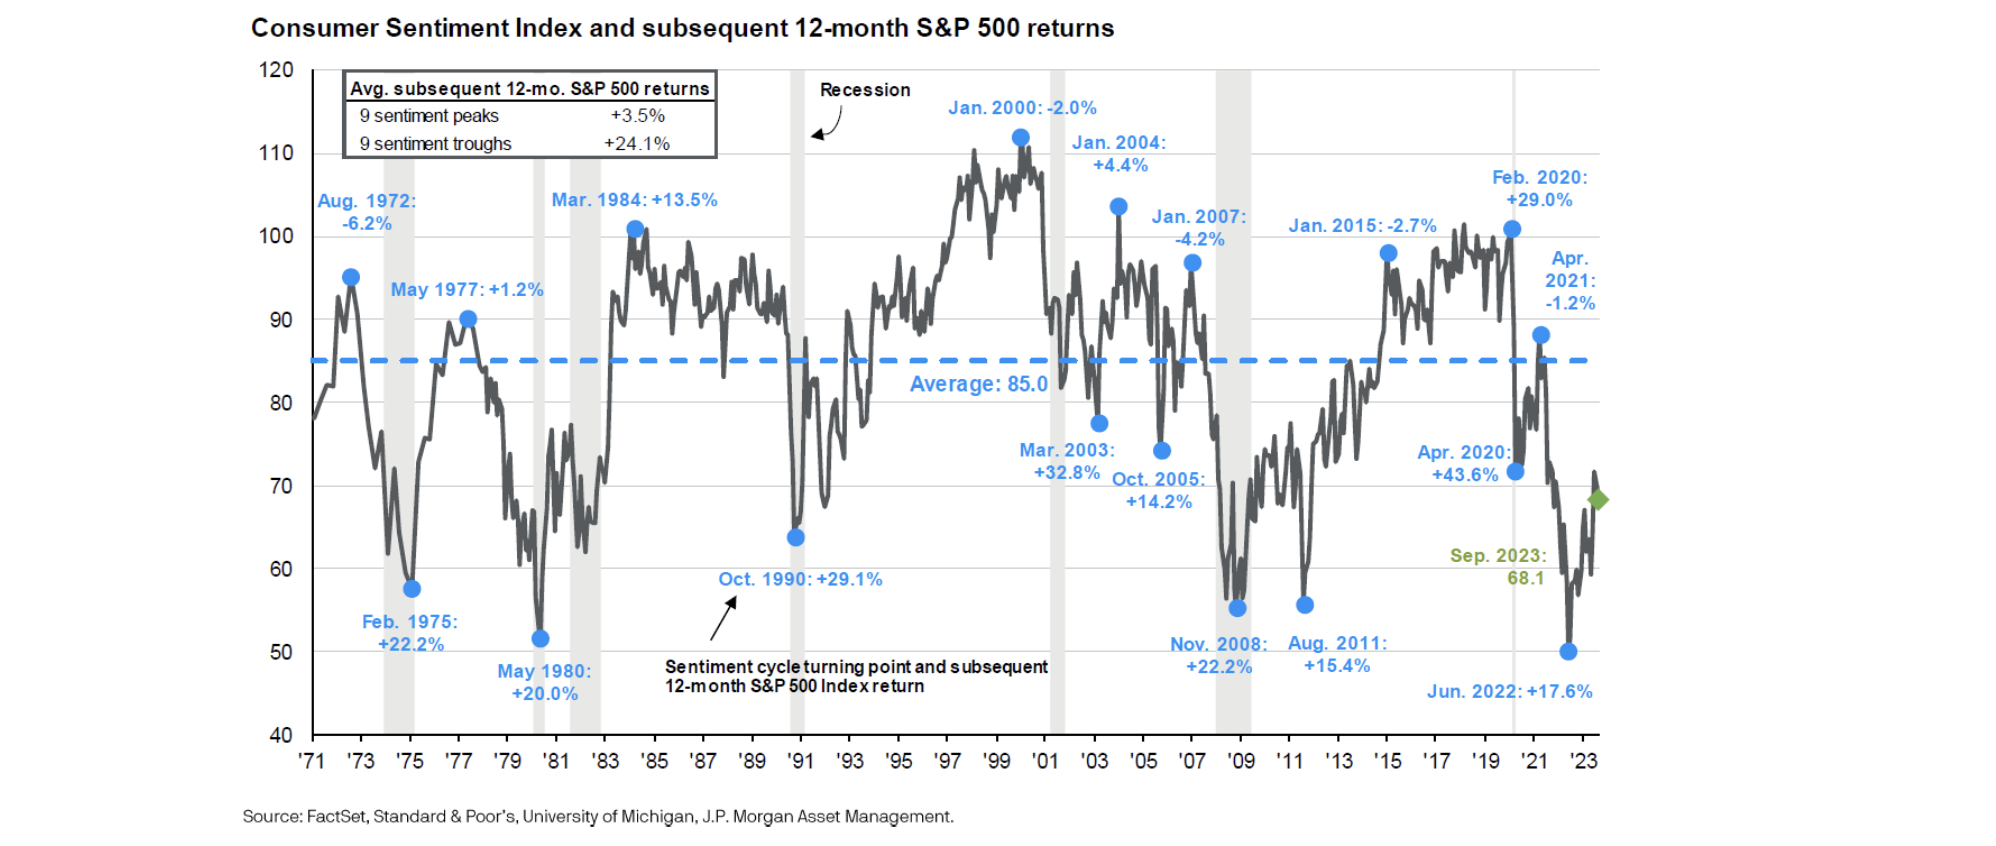
However, indicators, including VIX and AAII sentiment, are pointing to excessive optimism in November. Investors appear too complacent to the slowdown ahead. As a result, combining consumer and investor attitudes, overall sentiment readings appear to be neutral.
4. Liquidity
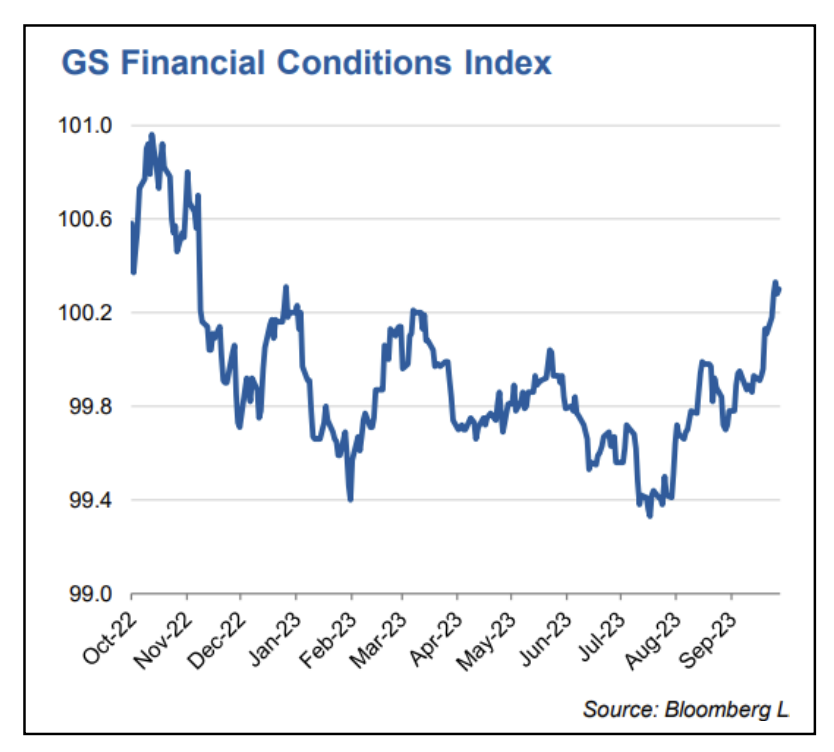
Liquidity is the fourth leg of our strategy framework. Large money movements can cause markets to move sharply over short periods of time.
The Financial Conditions Index (FCI) is very useful in assessing those conditions. The -10% correction in the third quarter occurred when the FCI moved up (right side of the graph) due to the rise in interest rates, with the 10-year UST rising from below 4% to 5%.
Financial conditions can be very volatile. FCI was down sharply in November, helping to lift stocks upward. This occurred as interest rates fell because investors believe that the Fed will cut rates significantly in 2024. We are concerned that the market is too optimistic about the magnitude of rate cuts for next year. With the Fed likely on hold, we are neutral on financial conditions.
Conclusion
Putting it all together, several of our indicators are flashing yellow, which is an upgrade over the broad number of red lights we saw six months ago. Looking at the weight of data covering fundamentals, valuation, liquidity and sentiment, equities appear to be in the beginning of the end stage of the bear market. However, there is still a lot to get through before a new market cycle begins, and the next 6-9 months are likely to be bumpy. We believe it is premature to chase the rally, and we recommend clients stay well diversified and utilize the strength of core bonds to ride out the volatility.
DISCLAIMER
Opinions and estimates offered constitute our judgment and are subject to change without notice, as are statements of financial market trends, which are based on current market conditions. Certain hypothetical market situations herein are based on historical data.
Certain statements contained herein may constitute “forward-looking statements.” Due to various risks and uncertainties, actual events or results or the actual performance may differ materially from those reflected or contemplated in such forward-looking statements. All investment involves the risk of loss.
Information contained herein has been obtained from sources we believe to be reliable, but we do not guarantee its completeness or accuracy. The information contained herein does not constitute legal or tax advice to any person. Please consult with your tax advisor regarding any taxation implications of the information presented in this presentation.

