Summary
Equity markets have become more volatile over the past few days. The market has become concerned that the US economy is falling into recession and that the Federal Reserve is behind the curve. Two economic growth statistics released late last week, the July jobs report and ISM Manufacturing, have raised growth concerns in the US. In our opinion, those growth worries are excessive and misplaced. The recent market moves appear to be more liquidity and sentiment driven than fundamental.
Due to stretched valuation (at the index level), growth stocks over-extended and rising political uncertainty, we came into this quarter neutral on global equities, including for the US. That has not changed. We also continue to advise using core fixed income to diversify a portfolio.
Macro News
Last Wednesday the Federal Reserve maintained rates at its July FOMC meeting. They indicated that an initial reduction could be on the table for its next meeting in mid-September. Fed officials said the risks are balanced between labor market softening and inflation. The Fed said that the jobs market is normalizing and still healthy and equity markets were up that day. However, on Thursday and Friday there were two reports that jolted the equity markets:
- The July jobs report came in lower than expected with a gain of 114,000 jobs. The unemployment rate rose to 4.3% from 4.1% in June.
- ISM Manufacturing PMI index fell to 76.9 a seven-month low.
Investors panicked and thought the economy was falling into recession and the Fed was behind the curve. However, a few points on the two reports from above:
- The unemployment rate rose largely because the participation rate rose. Moreover, UBS stated the number of people who reported being unable to work due to the weather was 436,000. Hurricane Beryl struck in July, a time that was covered by the recent jobs report.
- ISM Manufacturing PMI has been in contraction territory for 20 of the last 21 months so has been weak for a long time.
In addition to the data above, there were other economic data releases last week which were favorable but ignored by the market:
- Atlanta Fed GDP Now came out at a 2.5% economic growth rate.
- The Conference Board Consumer Confidence Index rose in July to 100.3 from a 97.8 in June.
- Pending home sales were up +4.8% in June vs. +1.5% expected.
- US Q2 Productivity came in at 2.3% vs consensus 1.8% and Q1’s 0.2%.
Importantly on Monday the July ISM Services PMI rose to 51.4 percent from June’s figure of 48.8 in June. The reading in July marked the fifth time the composite index has been in expansion territory in 2024. Important subcomponents show strength:
- The Business Activity Index rose significantly by 4.9 from June to 54.5 in July
- The New Orders Index expanded to 52.4 percent in July, 5.1 percentage points higher than June’s figure of 47.3
- The Employment Index expanded for just the second time in 2024, coming in at 51.1 which is a 5 percentage point increase over the 46.1 percent recorded in June.
The stock market did not find relief to the favorable services news due to being gripped by the slowdown fear. It should be noted that manufacturing, while in contraction according to ISM, comprises approximately 10% of US economic activity. Services, on the other hand, is expanding and accounts for nearly 80% of activity. One might think the market should weigh today’s service activity more than last week’s manufacturing data.
Moreover, US equity earnings are growing. Last Friday FactSet reported that analysts are expecting S&P 500 companies overall to post an 11.5% second-quarter earnings y-o-y. Entering earnings season, the projected growth rate was 8.9%. In other words, earnings are coming in stronger than expected.
Liquidity Unwind
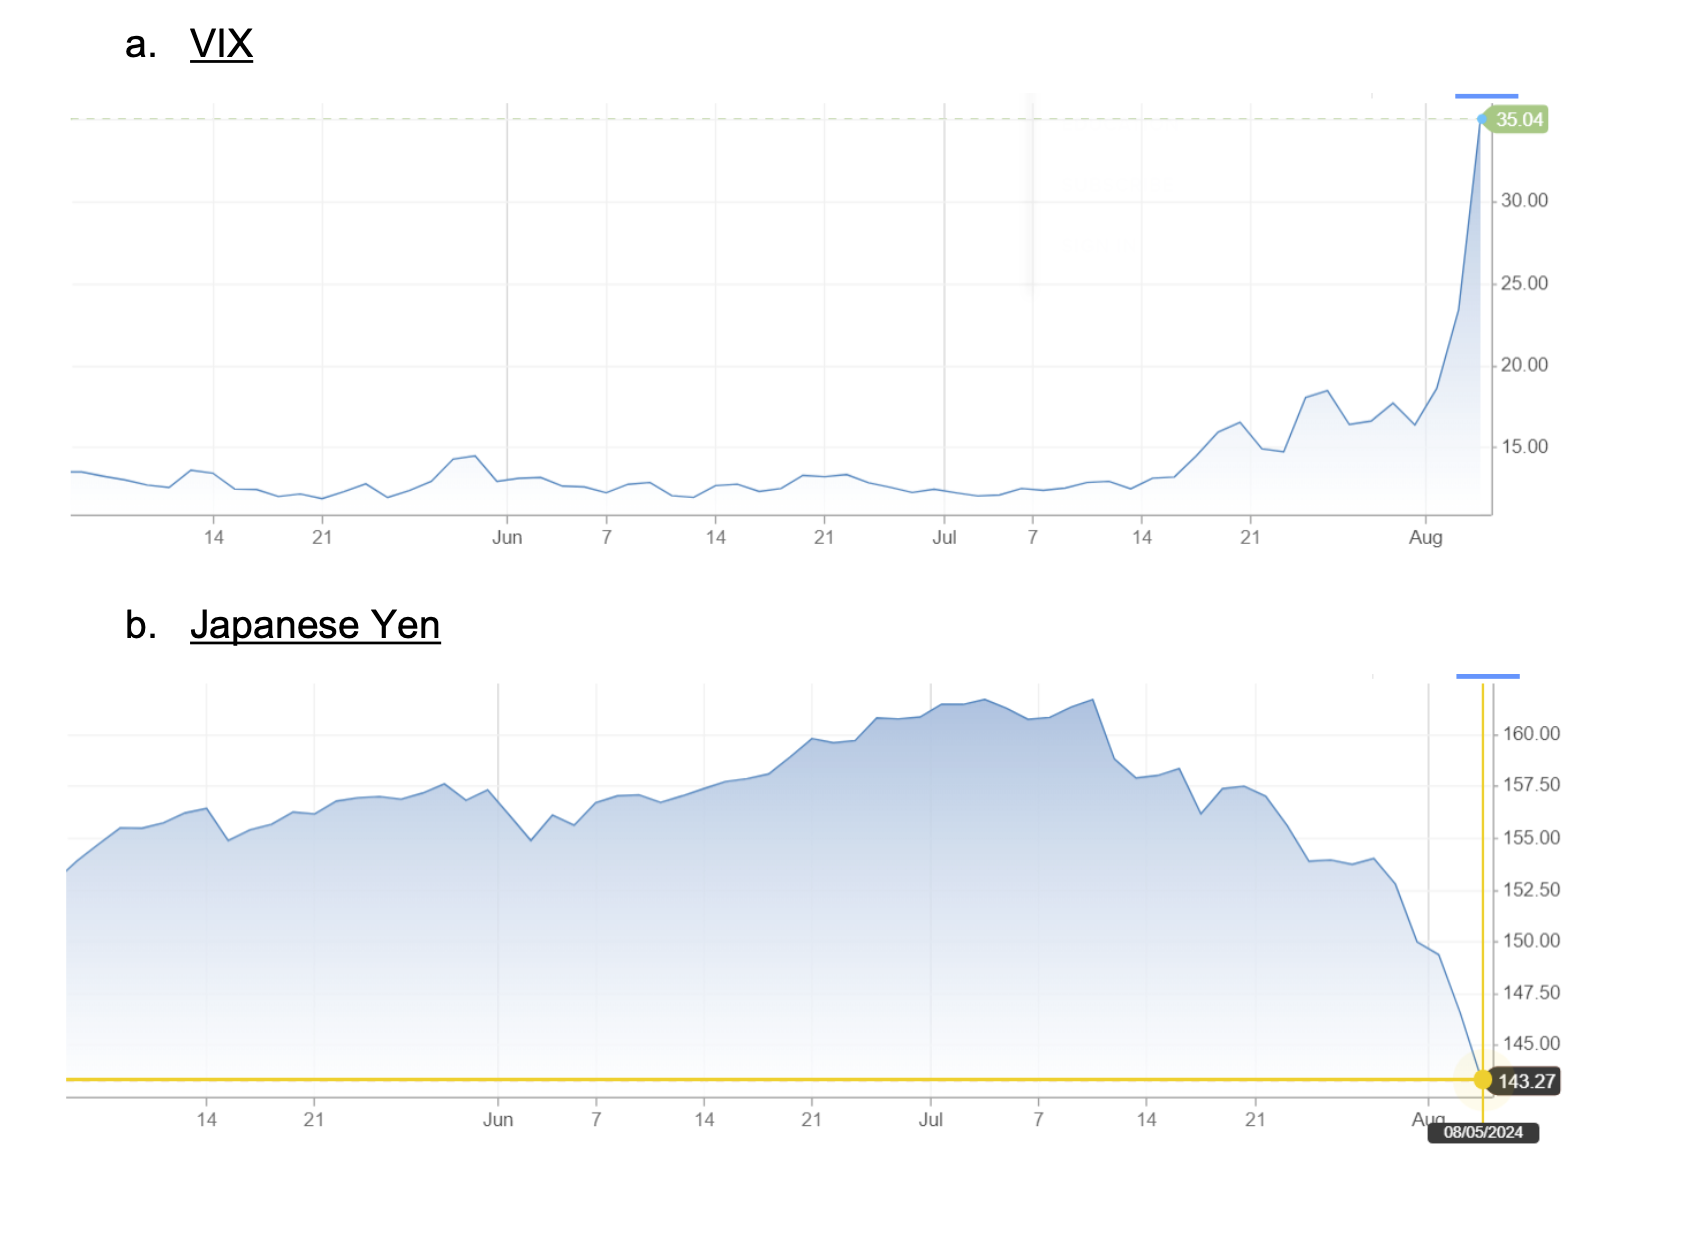
The recent pick up in market volatility appears to be a liquidity squeeze. It appears to be emanating out of Japan. Over the past two years, central banks around the world, except for Japan, were raising interest rates to counter inflation. Japanese interest rates fell to among the lowest in the world which helped push the Japanese Yen weaken to its lowest levels in decades. As a result, investors were able to borrow in Japan Yen at nearly 0% interest rates, swap into US dollars (for example) and invest in US assets. This “carry trade” could have pushed up the price of assets. At some point the investment could be then liquidated and Yen loan repaid using strong dollars, leading to a favorable return. Then last Wednesday the Bank of Japan finally raised interest rates after their policy meeting.
The carry trade unwound when Japanese rates rose last week. In essence, a margin call occurred as the Yen strengthened which further accelerated the sale of assets. US equity market volatility (measured using VIX) started to pick up as the Japanese Yen strengthened (using CNBC data):


There is no way to know exactly that the culprit is the unwinding of this Japanese Yen carry trade used by hedge funds, for example. We do know that it has been used a lot in recent years.
Moreover, the size of cross-border lending is been large, approximately $1.7 tn. This is an amount that could move global markets.
Critically, negative economic sentiment about the US economy and the Japanese Yen unwind are connected. As US economic sentiment worsened, US interest rates fell. The 2 Year US Treasury yield plummeted from 4.38% last Monday to 3.92% today, which reflects approximately two additional Fed rate cuts this year due to the growth scare. This helped further accelerate Japanese Yen strength as the interest rate differential with the US narrowed (recall that Japanese rates rose last week). The fair market value of the Japanese Yen is estimated in the JPY120/$ range. Today it is in the JPY143/$ level. As a result, the unwinding might not be over, so we still advise caution.
But it appears to us that this is not pointing to higher systemic risk given the stability in US rates today (UST 10 Year is down only 0.02%). If it was systemic, gold would be rising (it is currently falling) and bond yields would be plunging.
Putting it all Together
Summing up the macro —US economic growth is stronger than potential, earnings are rising better than expected at double digits, the Fed is set to reduce rates, jobs are being added and income is rising more than inflation. The volatility over the past few days appears to be a liquidity driven panic.
Given growth concerns and labor market worries, two data points that we are paying particular attention are layoffs and S&P PMI. Unemployment rising due to increases in job losses is a key recession harbinger. PMIs contain leading indicators such as new orders which point to future economic activity. This will assist us in ascertaining whether or not a soft landing will turn into a hard landing.
We believe the growth scare is both misplaced and an overreaction to data. However, the increase in volatility, even if temporary, can be unsettling. For those who want to “smoothen the ride” during stress events, hedge fund volatility strategies and core bonds are particularly appealing. Core bond yields offer flight-to-quality generally having a having higher allocation to AAA US Treasury bonds & mortgage backed securities along with high quality investment grade bonds. With inflation falling core bonds have an attractive real yield. Most of all, core bonds can offer peace of mind when volatility spikes. A well-diversified portfolio consisting of high quality investments is one of the best ways to ride out the volatility of market risk events.
Click here to download the PDF.
DISCLAIMER
The document is meant for educational purposes only and should not be considered as investment advice or a recommendation of any type, does not constitute an offer to sell, or a solicitation of an offer to buy or sell, any security, investment or other financial product and WE Family is not your investment adviser unless engaged through a client agreement.
The opinions and estimates offered constitute our judgment and are subject to change without notice, as are statements of financial market trends, which are based on current market conditions. These are based upon a number of assumptions concerning future conditions that ultimately may prove to be inaccurate. Certain hypothetical market situations herein are based on historical data.
Certain statements contained herein may constitute “forward-looking statements.” Due to various risks and uncertainties, actual events or results or the actual events may differ materially from those reflected or contemplated in such forward-looking statements.
Information contained herein has been obtained from sources we believe to be reliable, but we do not guarantee its completeness or accuracy. WE Family Offices does not make any warranty as to the accuracy, reliability or completeness of figures, opinions, information or generally as to the content of this document and cannot be held responsible for any loss or damage, whether direct or indirect, resulting from or related to the use or consultation of this document or of the information herein.
The information contained herein does not constitute legal or tax advice to any person.


